The following are a few selected custom-coded map applications that best demonstrate my GIS development skills. to view the applications, please click on the buttons below the images to launch the application in another window:
Urban Heat Explorer
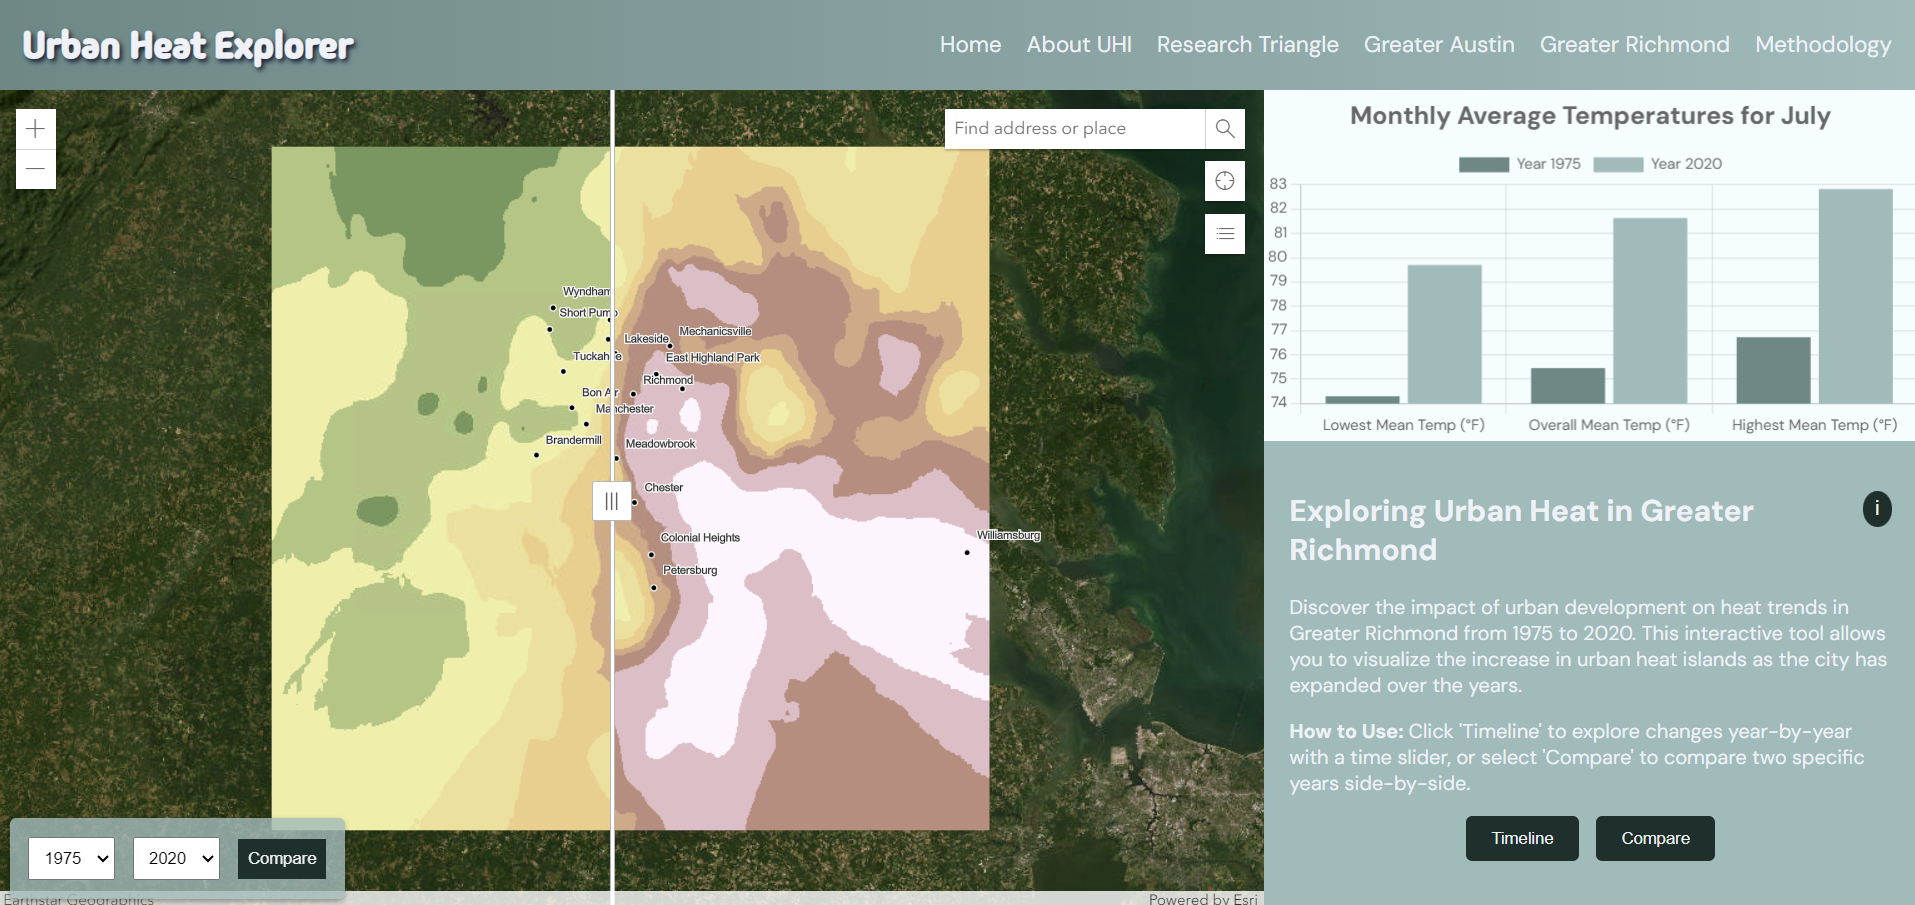
Urban Heat Islands (UHIs) significantly impact medium-sized metropolitan areas, which are often overlooked compared to larger cities. To address this, the Urban Heat Explorer was developed, focusing on metropolitan areas such as the Research Triangle, Greater Austin, and Greater Richmond. The application was developed using Python scripts for data and geoprocessing, and JavaScript to create an interactive user interface with the ArcGIS for JavaScript API and Chart.js. This application visualizes average temperature data from 1975 to 2020, highlighting changes every five years in July. It features a “Time View” for year-by-year examination of the data and a “Compare View” with a swipe function for comparing years. Each view is paired with dynamic and interactive graphs created with Chart.js to further visualize the data. Designed for urban planners and policymakers, this tool supports informed decision-making by illustrating temperature variations due to urbanization, thus aiding sustainable urban development strategies.
First Landing State Park
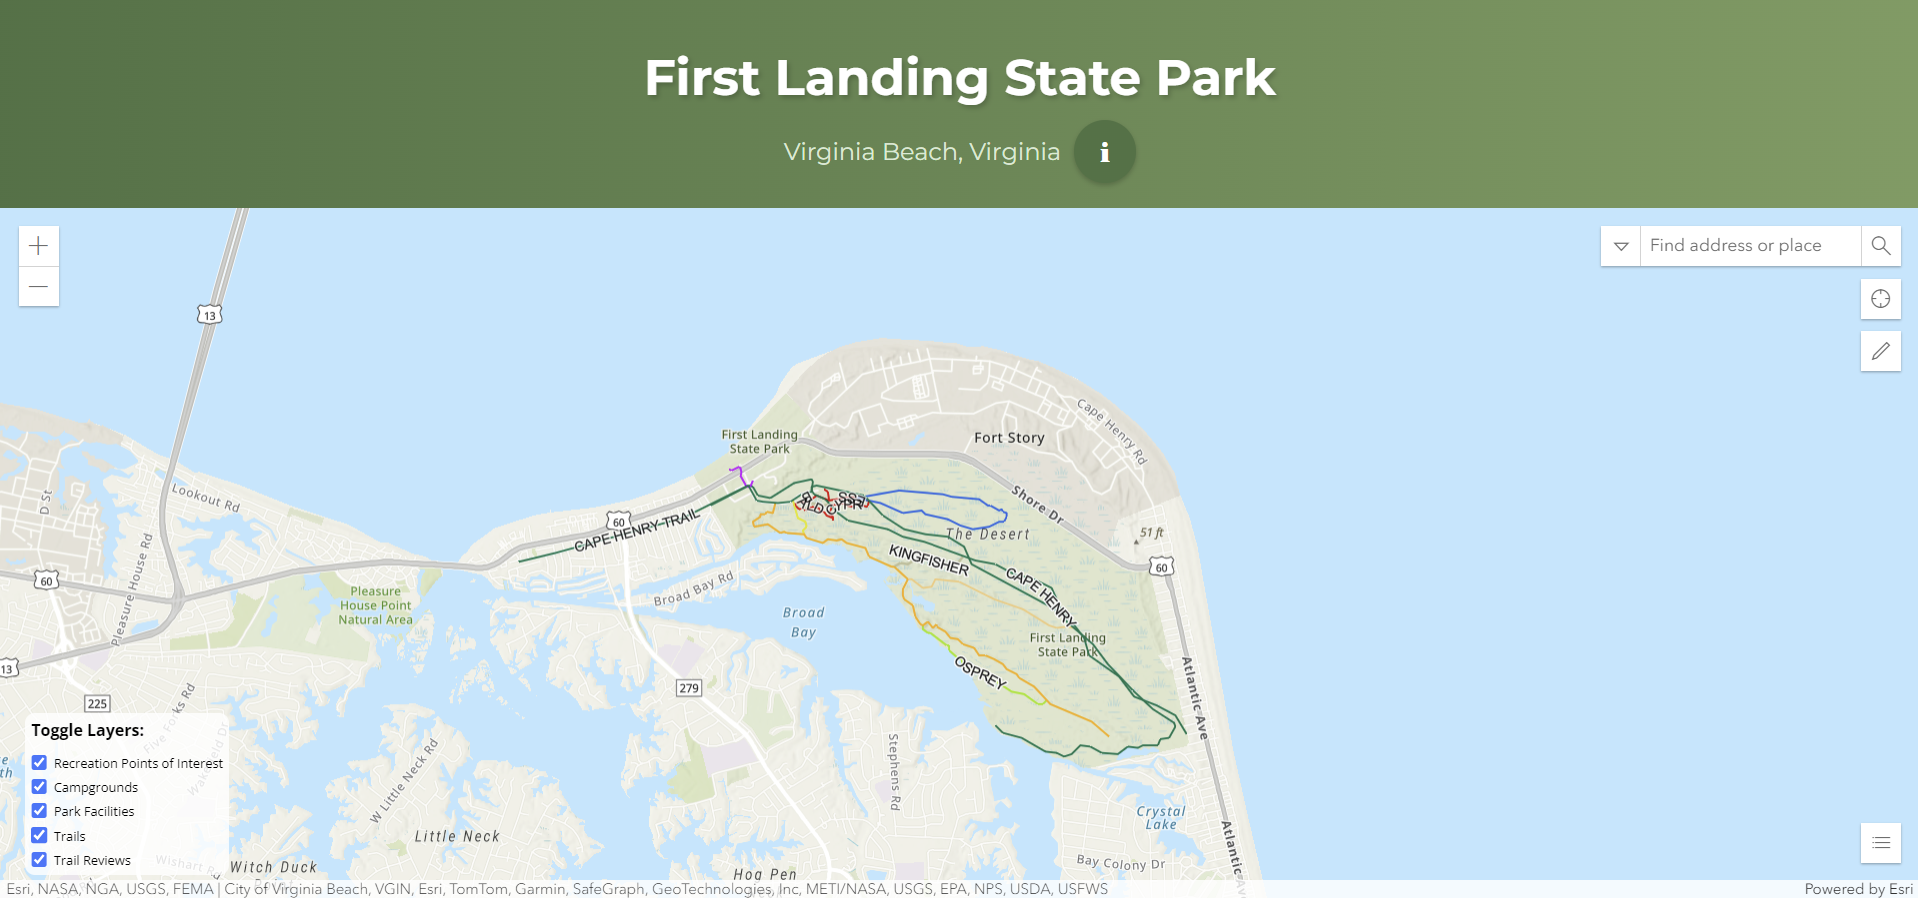
This interactive and mobile-friendly web map application to enhance visitor experiences at Virginia’s most-visited state park, First Landing State Park. This application provides a comprehensive digital guide to the park’s amenities, such as trails, beach access, and historic sites. It allows users to navigate the park efficiently, identify points of interest, and contribute trail reviews.
City of Memphis Park Explorer
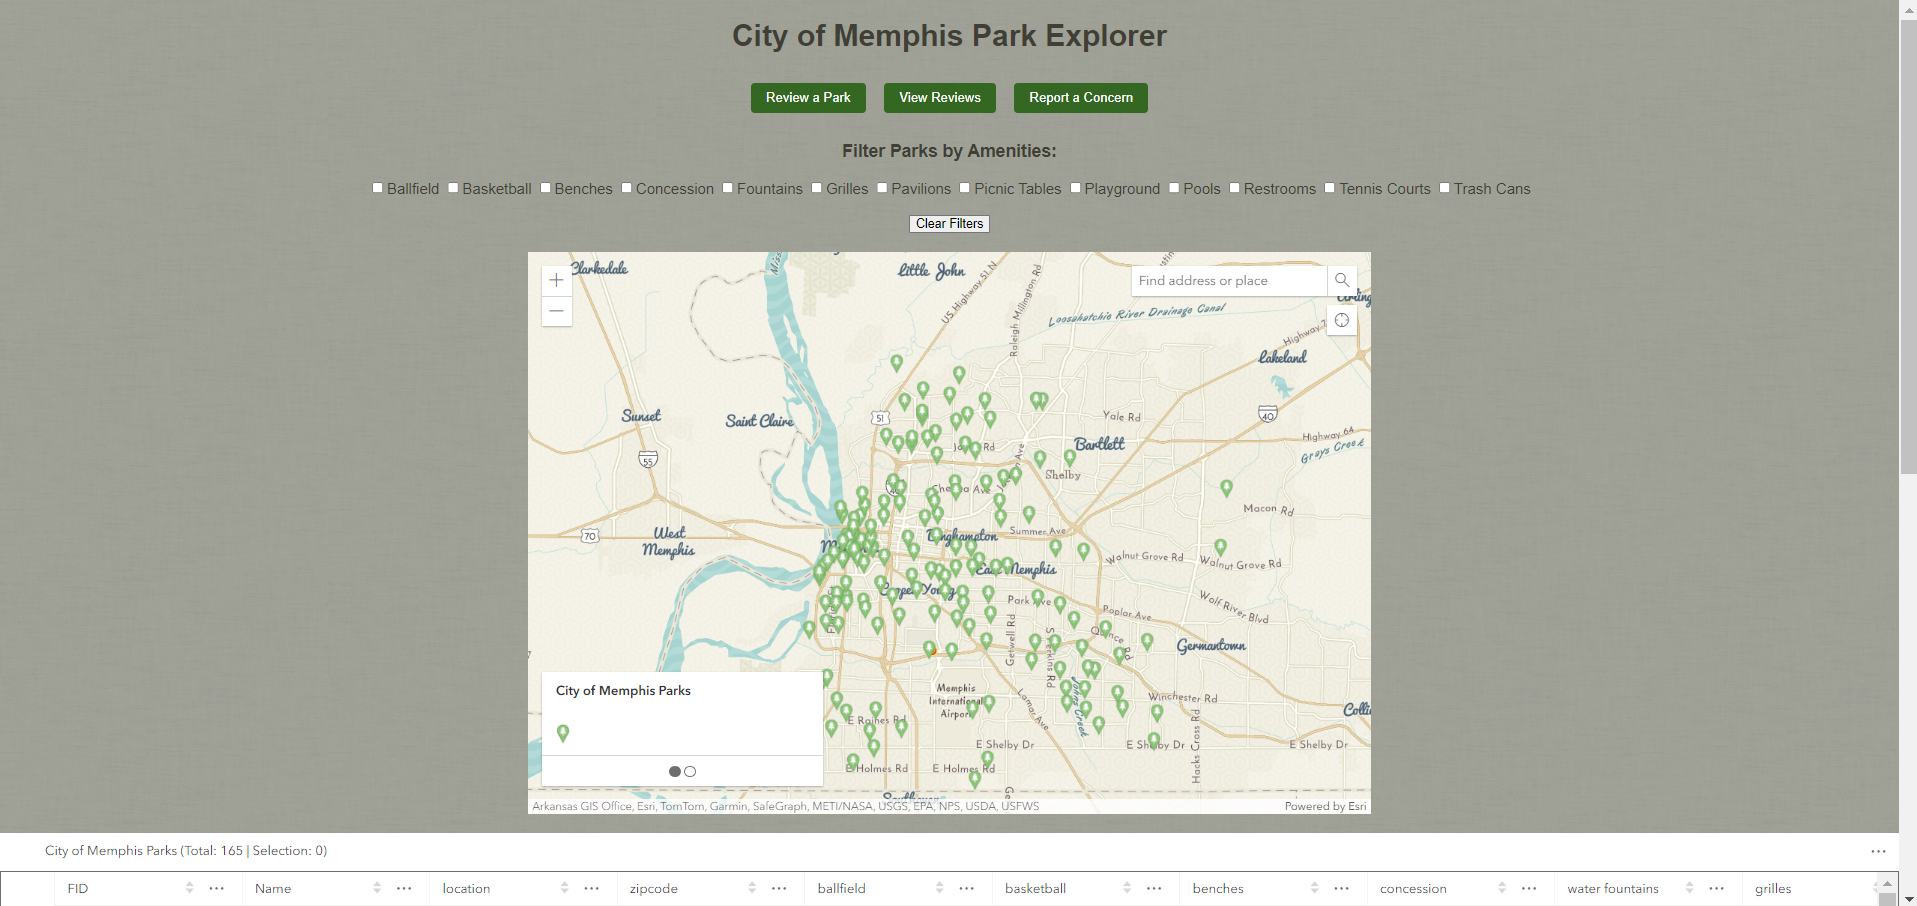
The Memphis Park Explorer is a web map application that enhances the outdoor experience for residents and tourists in Memphis by simplifying the discovery and evaluation of parks. This tool allows users to search and filter nearly 150 parks within the Memphis Parks System based on specific amenities, such as tennis courts or playgrounds, using comprehensive data stored on ArcGIS Online. Moreover, the application includes a maintenance reporting feature, integrated with Survey123, enabling users to quickly report park issues. This not only aids the Parks and Recreation staff in efficient maintenance but also allows the community to leave reviews, fostering informed decisions and continual improvements to the park facilities.
Wisconsin Nitrate Level and Cancer Rate Relationship Explorer
This desktop application analyzes the relationship between nitrate levels in groundwater and cancer rates in Wisconsin. Utilizing Python and ArcPy for GIS analysis, it allows users to interactively modify analysis parameters and visualize the spatial correlation on maps. This tool demonstrates the application of GIS technology in public health and environmental research. As a local GUI application, this application is demoed in the video above.