The following are maps I selected to represent my skills and projects I have worked on:
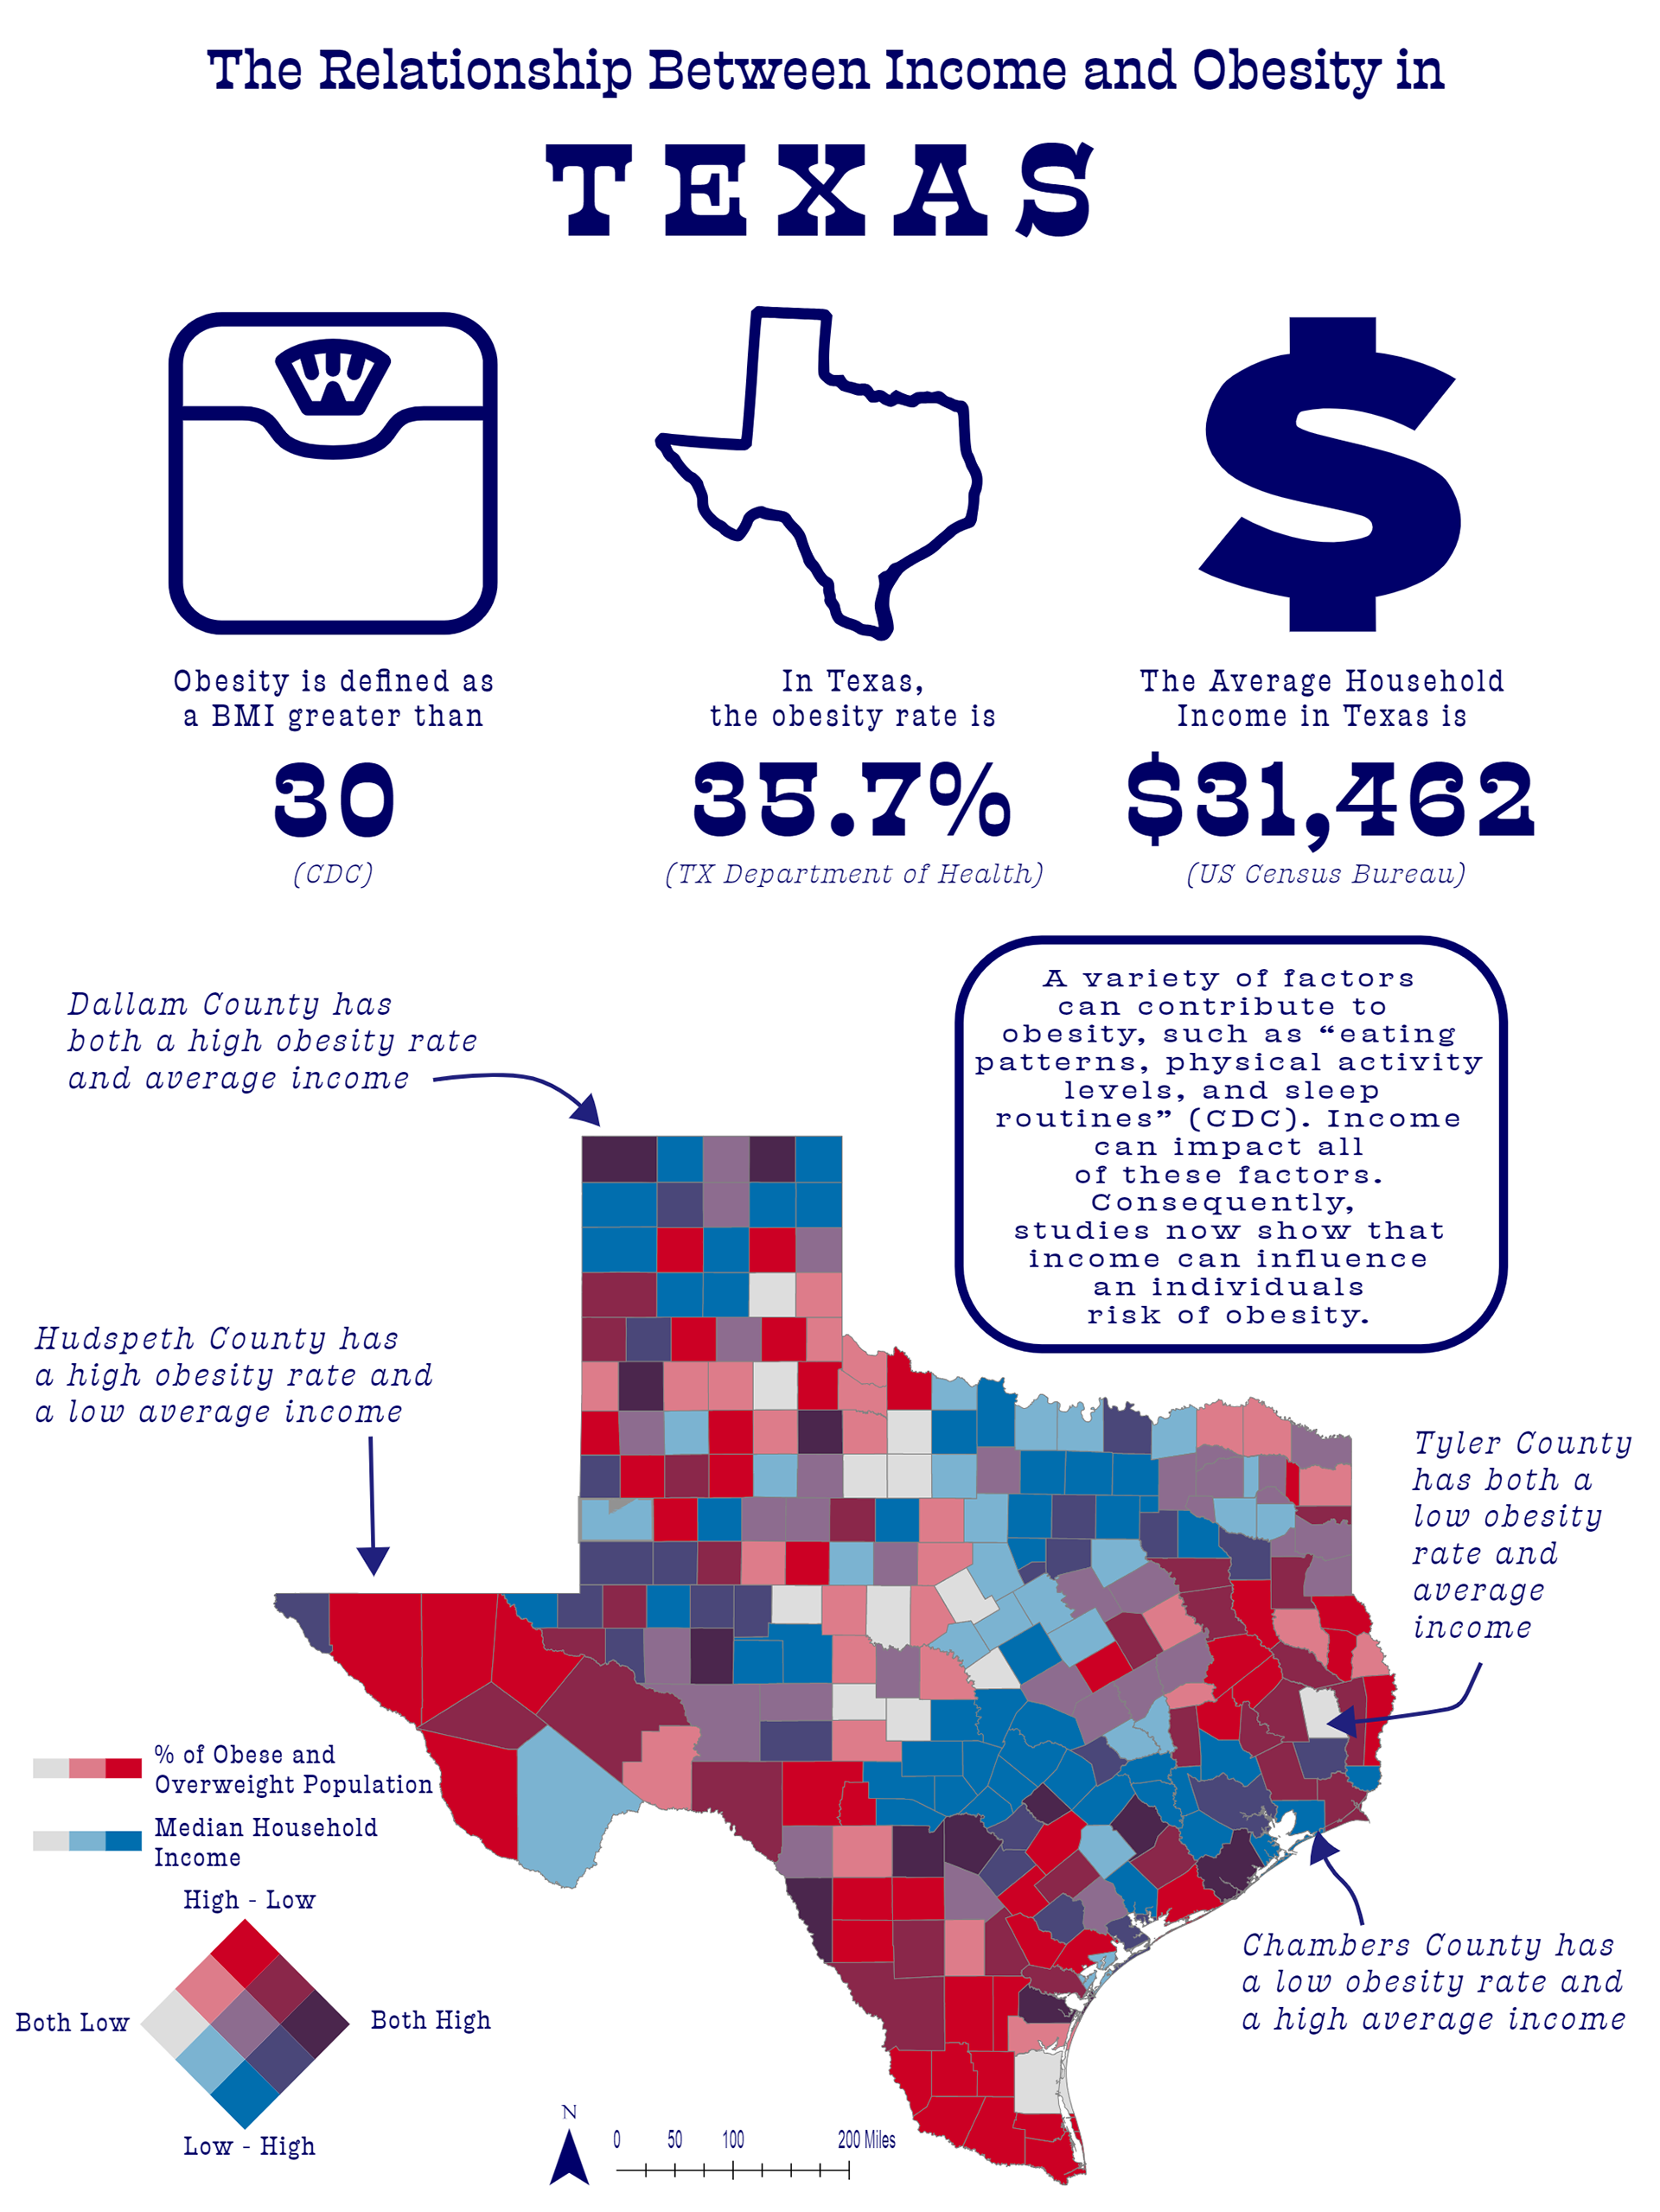
I created this infographic for a class at UW-Madison. It includes a bivariate map that shows the relationship between income and obesity.
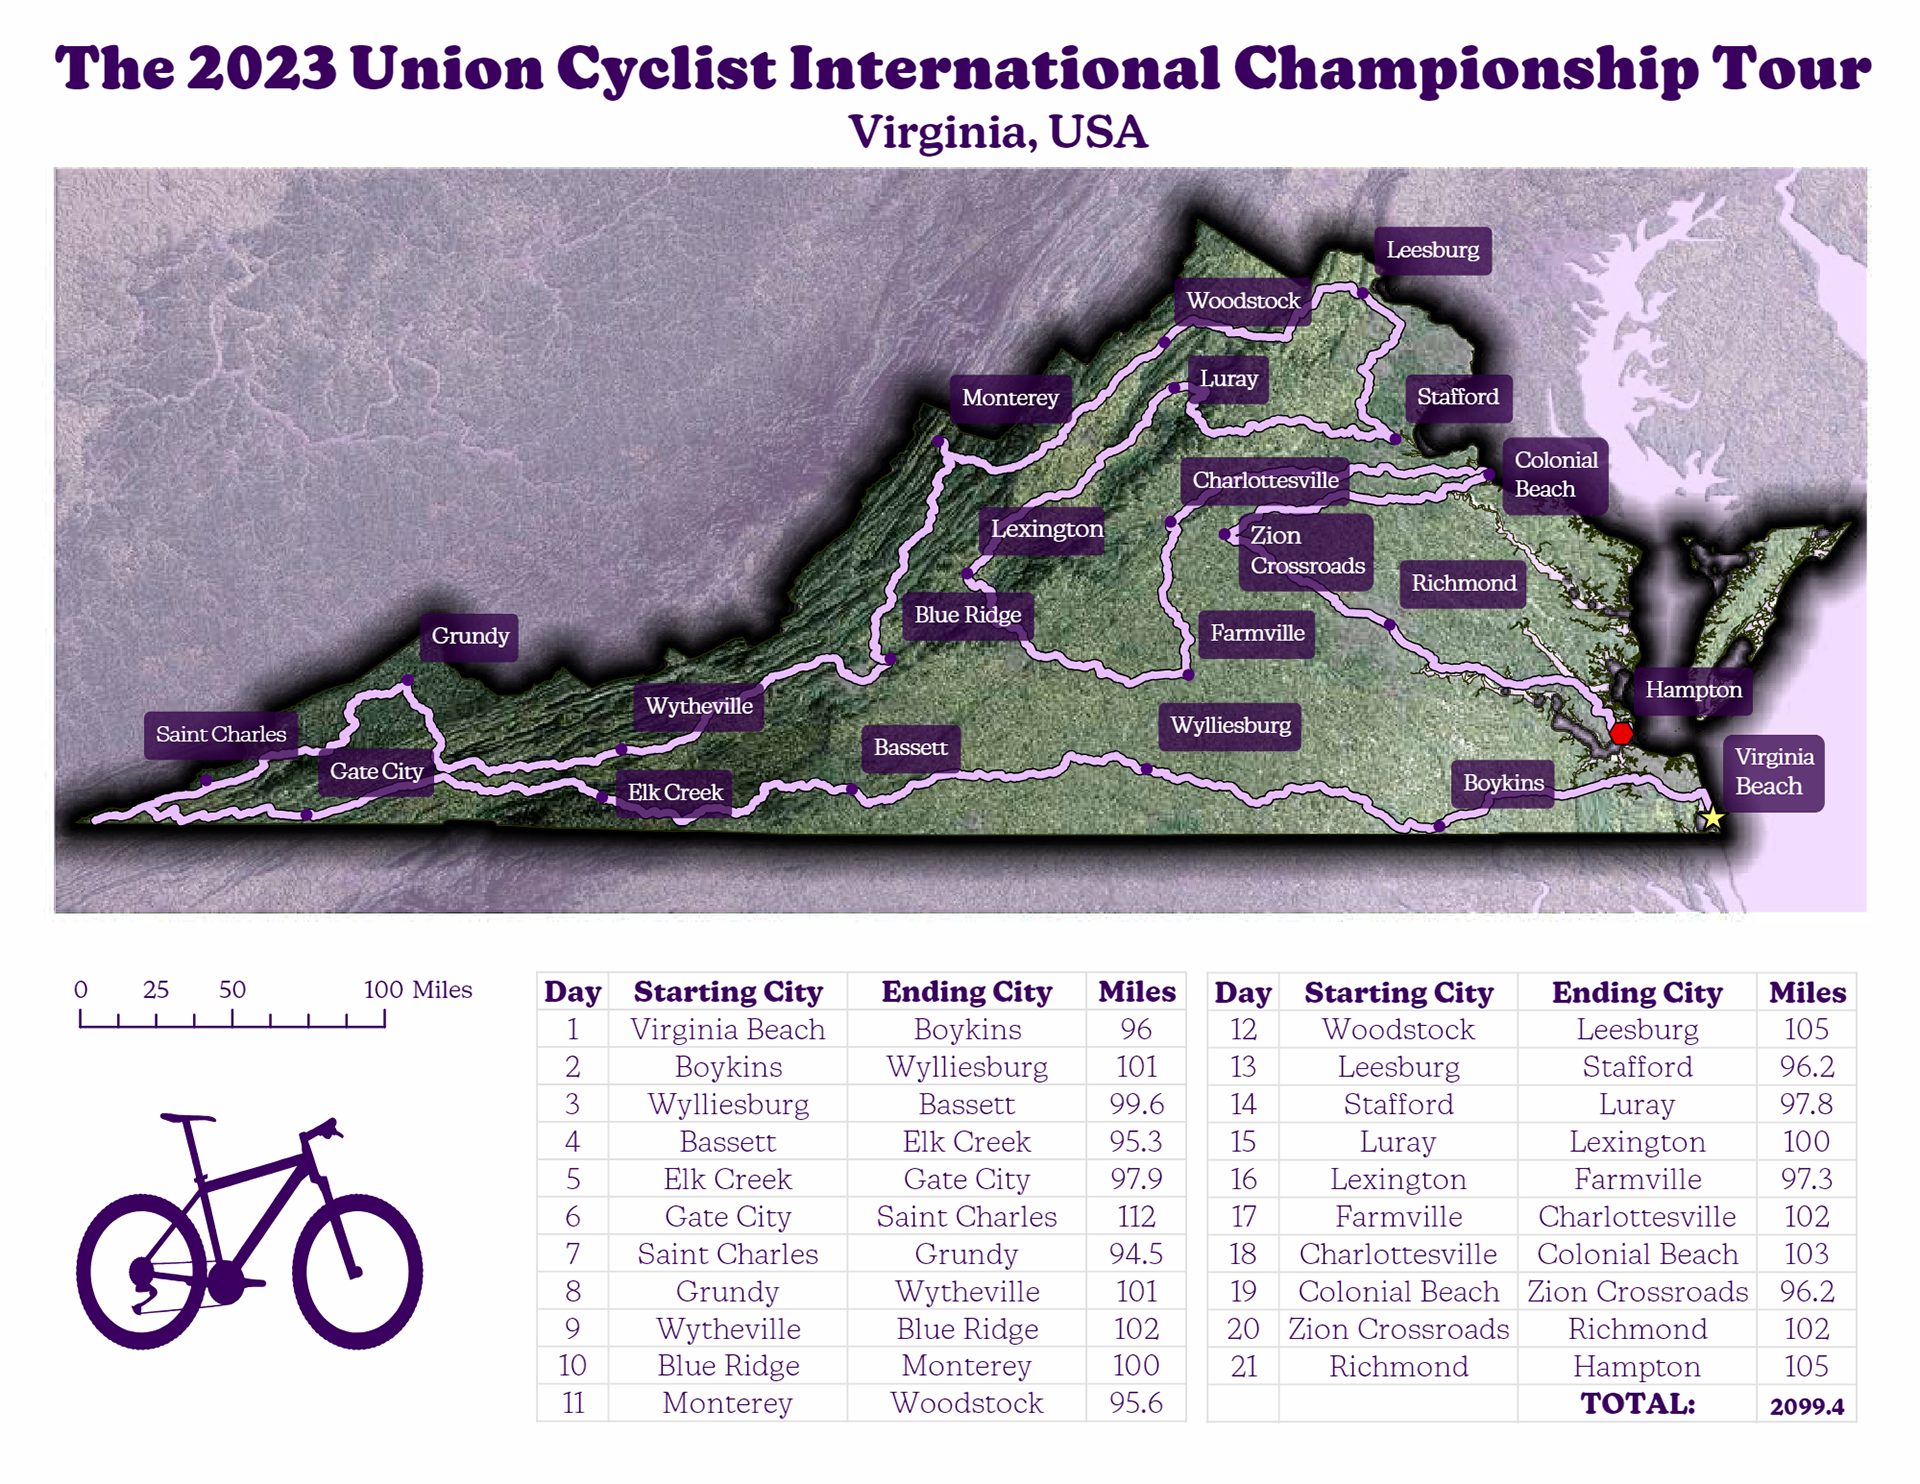
I also created the map above for a class at UW-Madison. I created the route and data. More importantly, I created the custom hillshade seen in the basemap.
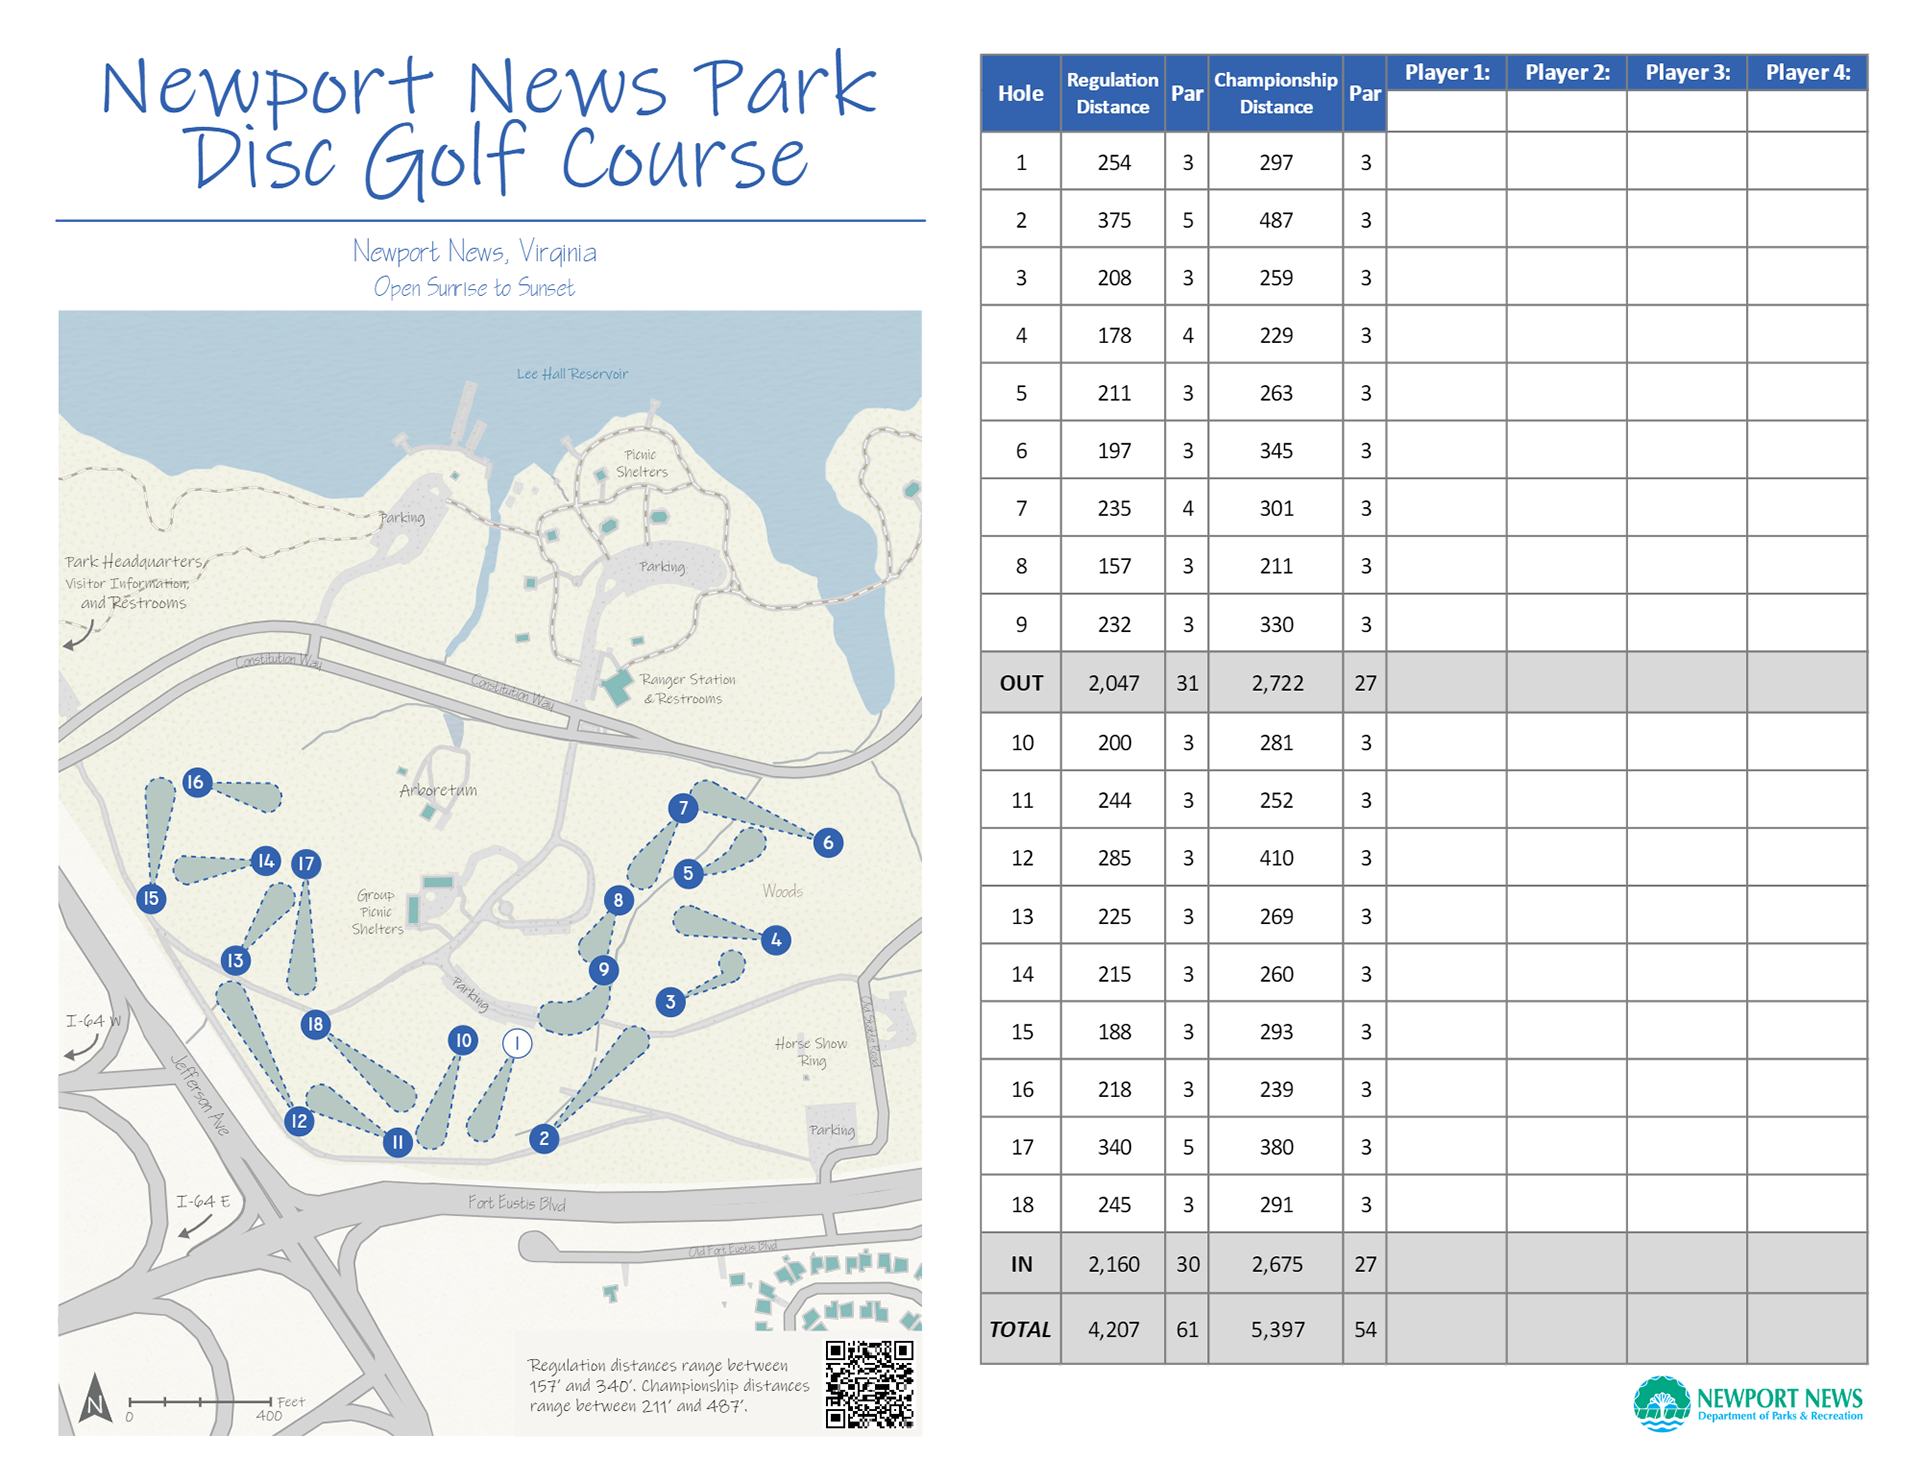
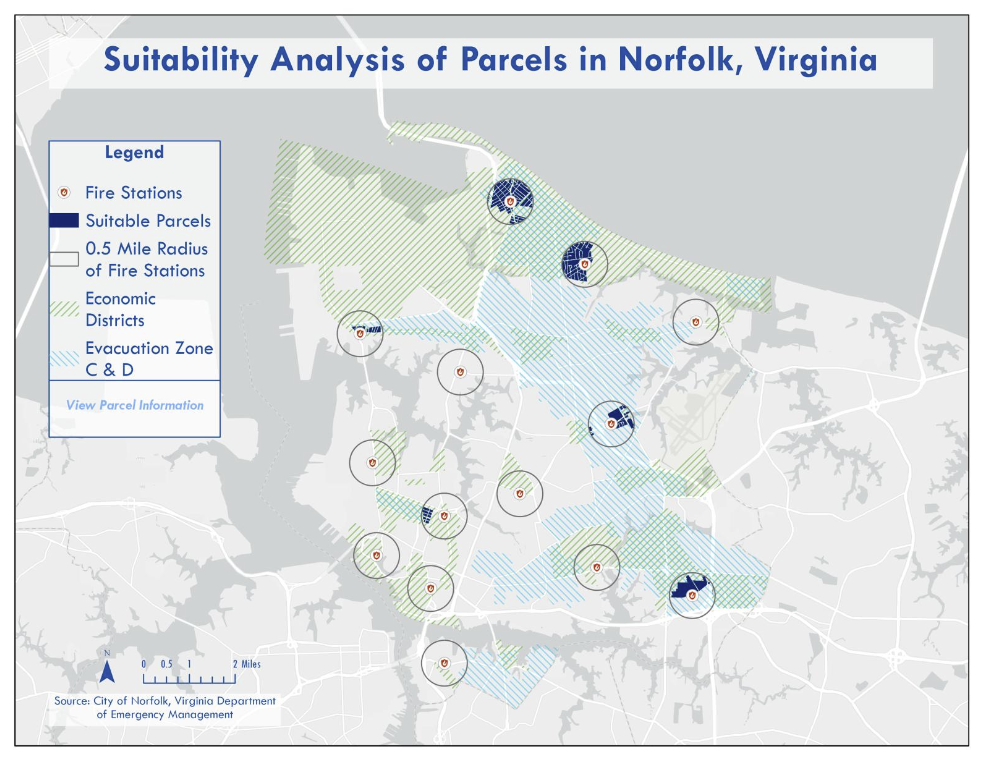
I created the following map during my internship with the City of Newport News. I was responsible for redesigning the score card and drawing in the route.